Selection
S values
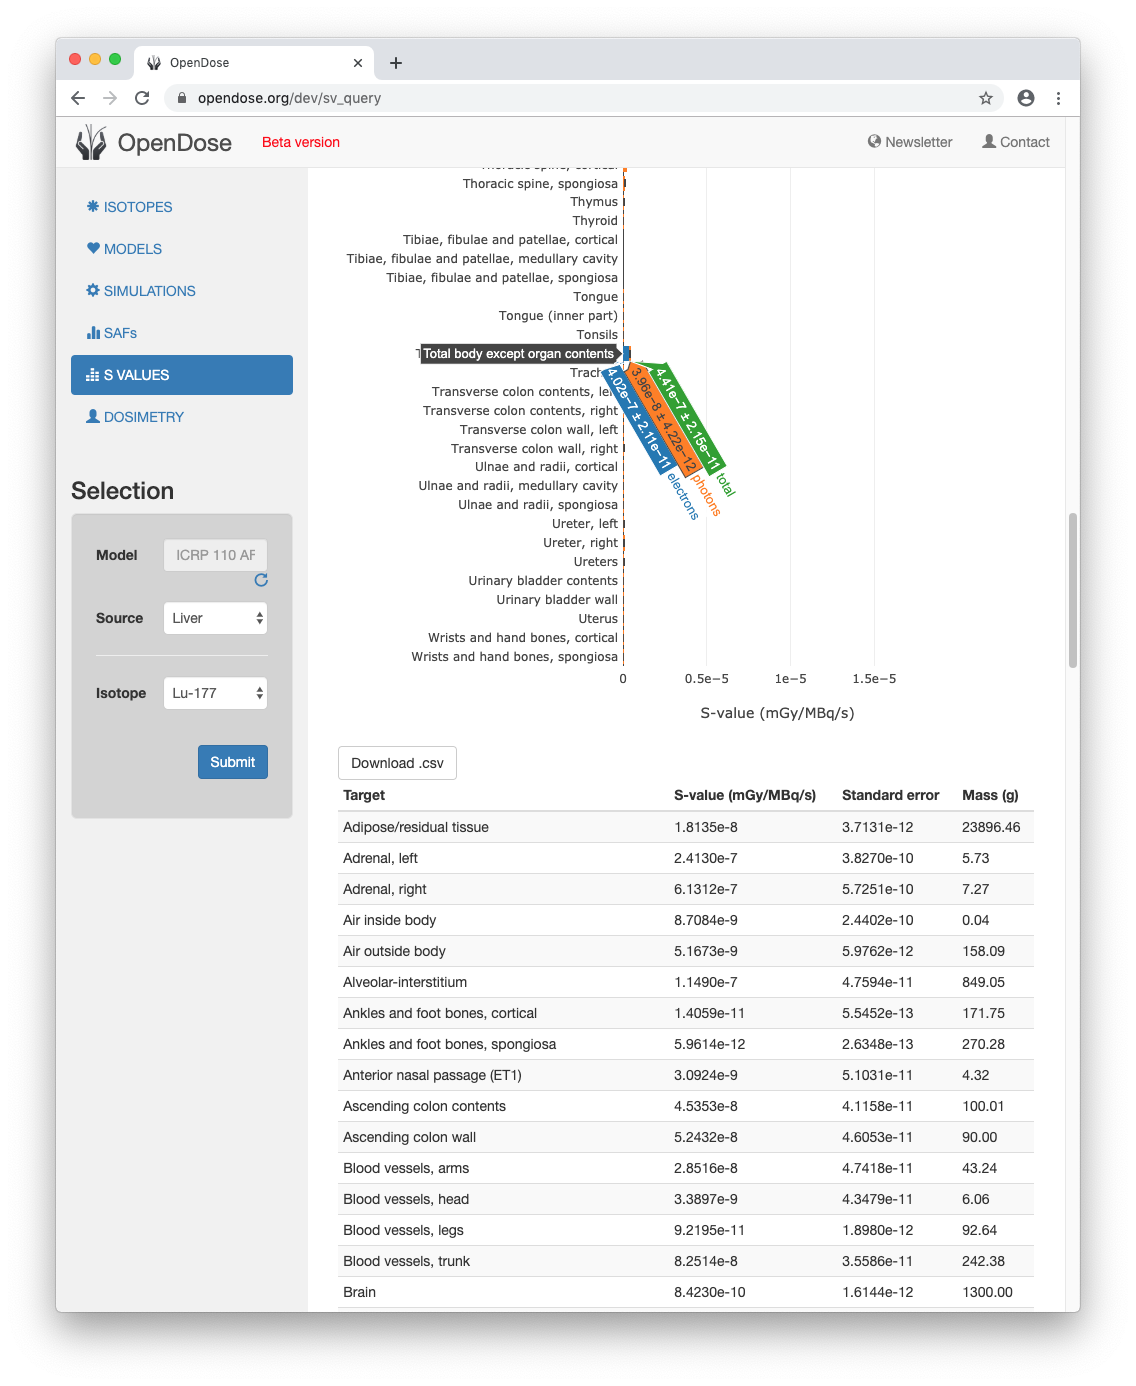
To display S values, first select a model from the left panel, then select a source and a radioisotope.
The S values calculated refer only to the radionuclide under consideration, so to evaluate the absorbed dose one must consider the decay and the S values of all the daughters.
S values are calculated following the equation: \[ S_{\left( Target \leftarrow Source \right)} = \sum_i y_i E_i \Phi_{i \left( Target \leftarrow Source \right)} \] where \( \Phi_{i \left( Target \leftarrow Source \right)} \) is the Specific Absorbed Fraction (SAF, kg-1) for radiation type i and \(y_i\), \(E_i\) are the yield (Bq-1.s-1) and energy (J) of radiation type i, respectively.
A Python program performs the calculation for a selected set of parameters (model, source, radioisotope). From the selection and for each target, the Python script queries all corresponding SAFs from the OpenDose database and the radioisotope decay data of ICRP publication 107 [1]. The SAFs are then averaged between all Monte Carlo codes and interpolated to each radiation type energy of the selected radioisotope. Then, the interpolated SAFs are multiplied by the yield and energy of this radiation type or interpolated over the beta spectrum. Finally, every radiation type contribution is summed to give the S value.
The S value statistical uncertainty is estimated following the equation: \[ \sigma \left( S_{\left( Target \leftarrow Source \right)} \right)^2 = \sum_i \left( y_i E_i \sigma \left( \Phi_{i \left( Target \leftarrow Source \right)} \right) \right)^2 \] where \( \sigma \left( \Phi_{i \left( Target \leftarrow Source \right)} \right) \) is the SAF statistical uncertainty (kg-1) for radiation type i and \(y_i\), \(E_i\) are the yield (Bq-1.s-1) and energy (J) of radiation type i, respectively.
This section allows to get S values for 2 models, 141 sources, 172 targets and 1252 radioisotopes. An interactive chart shows S values for all targets per particle type contribution, with their statistical uncertainties. A table at the bottom of the page shows S values with their statistical uncertainties for all targets and the mass of the target. The data from the table can be easily downloaded in CSV format with a button placed on top of it.
Note: the S value calculation involve a lot of operations and requires ~50 ms per target, it is normal to wait a few seconds for the result page to appear.